FDA Food Standard Violation Data Visualization
29 May 2015
Motivation
To explore the food safety violation dataset and compare it to recent food scandals.
Study Type
This is a simple exploratory analysis, no association or causality implied.
The Data
Data Processing
- Load FDA food safety violation dataset.
- Transform it to the structure which d3.js could use. The data values aren’t changed.
- For wikipedia source, copy the table, paste it on google sheet, and then export it as csv. If there are more than one entry in a row, then seperate them by date.
Visualization
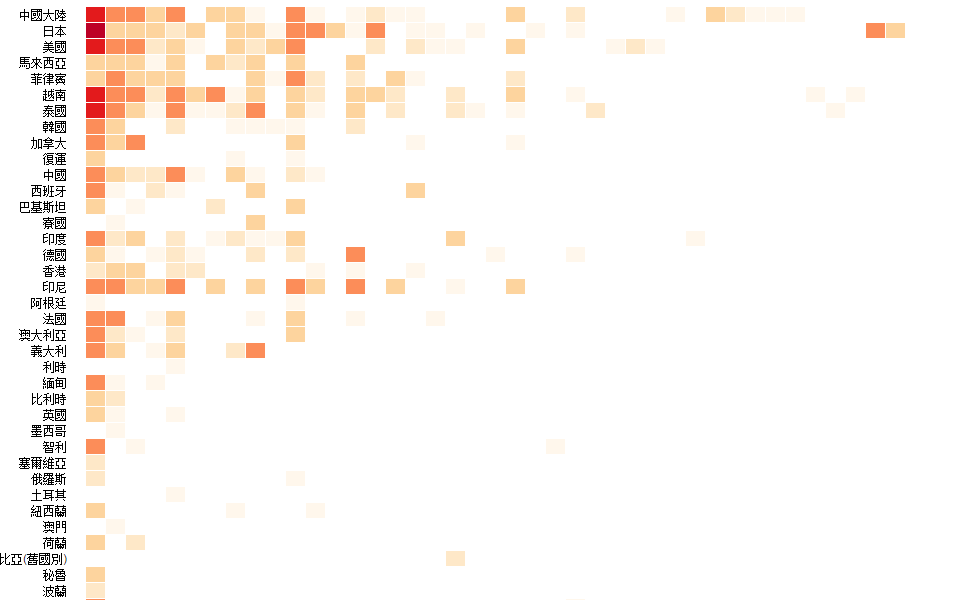
- This graph display the cases by countries of origin and the violated regulation.
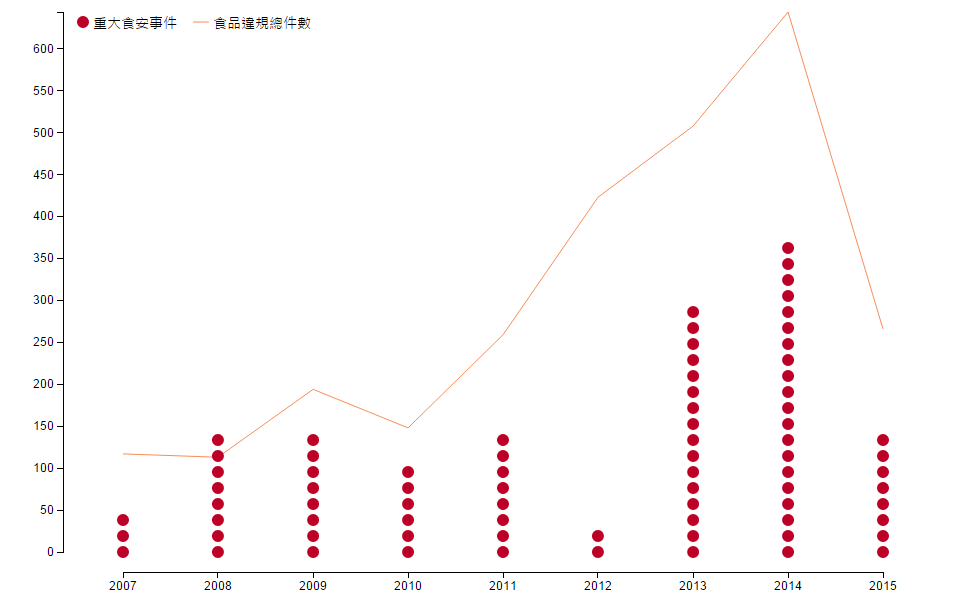
- The second graph put the cases and the food scanfals of the same year together. This graphc allows us compare their trends but doesn’t imply they have any association.
Result
- Most cases are from Japan(532), America(366) and China(276).
- Most cases violate pesticide(1384), preservative(286) and veterinary drug(198) residue standard.
- Most food scandals are local cases.
Without detail information, the case number doesn’t tell us much. For example, the reason why there are more cases from Japan could be that we love Japanese food and import much more from Japan than from other countries.
However, the food scandals are serious problems. Even though FDA tried to prevent bad food from importing into Taiwan. They failed to regulate local food companies and the situation is getting worse.
Source code
blog comments powered by Disqus