DDData design, development, data vizualization
FDA Food Standard Violation Data Visualization
Motivation
To explore the food safety violation dataset and compare it to recent food scandals.
Study Type
This is a simple exploratory analysis, no association or causality implied.
The Data
Data Processing
- Load FDA food safety violation dataset.
- Transform it to the structure which d3.js could use. The data values aren’t changed.
- For wikipedia source, copy the table, paste it on google sheet, and then export it as csv. If there are more than one entry in a row, then seperate them by date.
Visualization
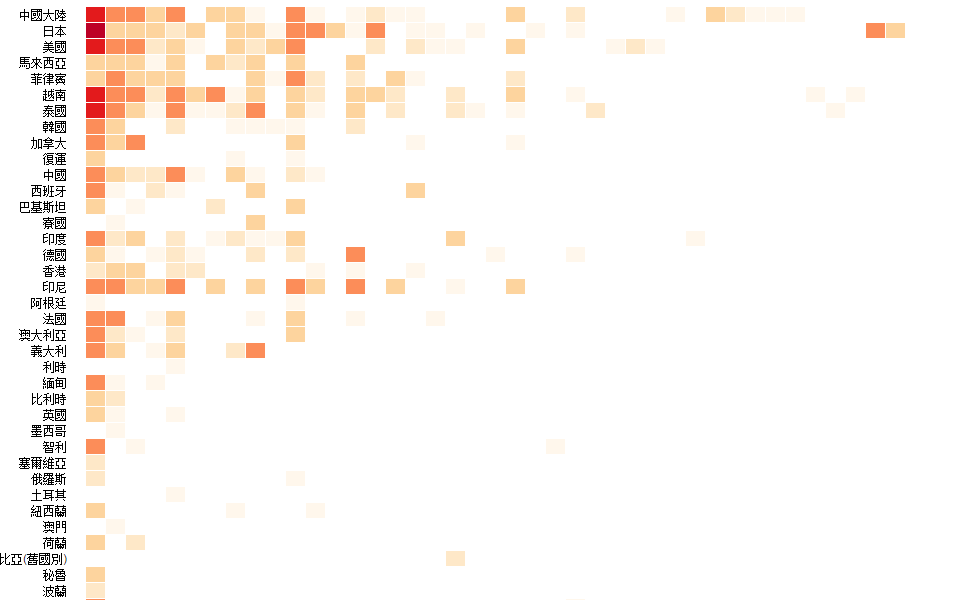
- This graph display the cases by countries of origin and the violated regulation.
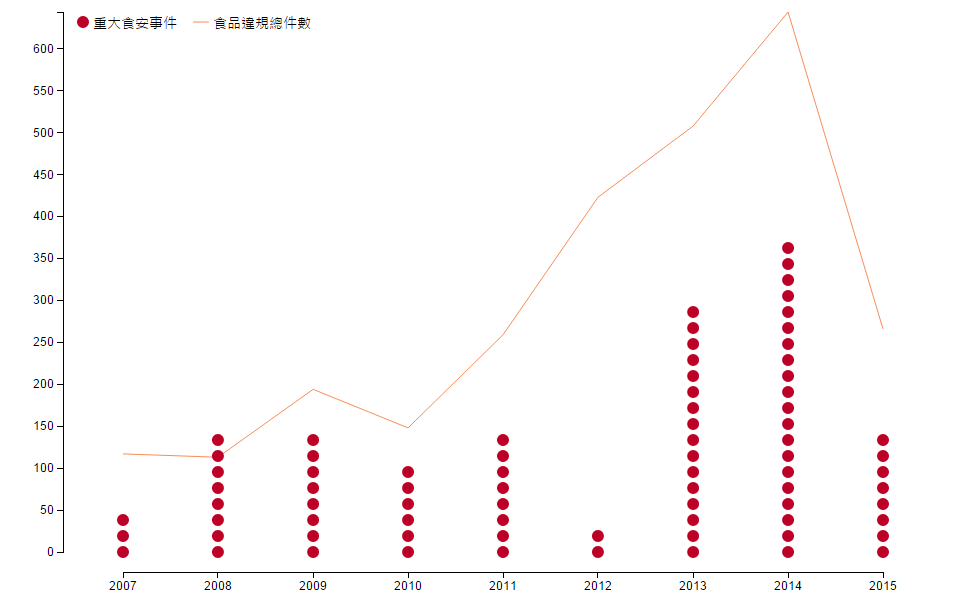
- The second graph put the cases and the food scanfals of the same year together. This graphc allows us compare their trends but doesn’t imply they have any association.
Result
- Most cases are from Japan(532), America(366) and China(276).
- Most cases violate pesticide(1384), preservative(286) and veterinary drug(198) residue standard.
- Most food scandals are local cases.
Without detail information, the case number doesn’t tell us much. For example, the reason why there are more cases from Japan could be that we love Japanese food and import much more from Japan than from other countries.
However, the food scandals are serious problems. Even though FDA tried to prevent bad food from importing into Taiwan. They failed to regulate local food companies and the situation is getting worse.
Source code
Taipei MRT passenger visualization
Motivation
To explore the Taipei MRT passenger count dataset and look for any patterns or outliers.
The data
Data Processing
- Load data files. Use a custom loader to deal with asynchronous loading. This loader accepts an array of urls and loads them one by one. When all files are loaded, the loader will fire a dataLoaded event, then move on to data processing.
var csv = d3.dsv(",", "text/csv; charset=big5"); //Dataset contains chinese characters.
MultiDataLoader.prototype = Object.create(EventTarget.prototype, {
	startLoading : {
		value : function(){
			var dataurl = this.__url[this.__fileLoadedCount];
			csv(dataurl, function(d){
				loader.fileLoaded(d);
				return;
			});
		},
		enumerable : true
	},
	fileLoaded : {
		value : function(d){
			rawData.push(d);
			this.__fileLoadedCount ++;
			if(this.__fileLoadedCount === this.__fileCount){
				this.__fire(
					new DataLoadedEvent(d)
				);
			}else{
				this.startLoading();
			}
		},
		enumerable : true
	}
});
Data processing
The main dataset is an array of objects which represent MRT stations.
1. First, extract the list of stations and create station object for each item in the list.
2. Then assign the basic information such as line, id, etc, to the station name.
3. The passenger count data will be an object like this.
passengerCount = {
	2015-04-01:{in: 5000, out:5000},
	2015-04-02:{in: 4000, out:4000},
};
Visualization
- Use different stroke style to represent passenger-in and passenger-out.
- Use color to represent the MRT lines.
- The size of circle represent the passenger count.
- On mouseover, display the count number and the average on the top-left corner.
Check the result in full screen.
Source code
d3.js + Leaflet map
Motivation
One of the best way to visualize the data about a city is to render it on a map. This way allows viewers connecting their spatial experience with the data and creating stronger engagement.
Sample Code
The first step is to initialize a leaflet map object. This map object will provide a complete interactive map and some important functions that help us mapping data to the map. The setView function takes 2 arguments, the first is the postion(latitute, longitutde) and the second is zoom scale.
<div id="map"></div>var map = L.map('map').setView([25.046374, 121.517896], 13);Then setup tileLayer for the map. Different tileLayers vary style and detail. Here are different map providers and their demo.
L.tileLayer(
            'http://{s}.tile.openstreetmap.org/{z}/{x}/{y}.png', {
            attribution: '© ' + mapLink + ' Contributors',
            maxZoom: 18,
            }).addTo(map);
Create a svg layer on the map and assign it as svg. This way allows the appended svg elements moving with the map.
map._initPathRoot();
var svg = d3.select("#map").select('svg');
Now we can load the data and start our regular d3 visualization processes. One key step is using the latitude and longitude of the data as coordinates for rendering elements on the screen. The function we used here is map.latLngToLayerPoint(LatLngObject). LatLngObject is create by L.LatLng(latitude value, longitude value). We can assign the return value of latLngToLayerPoint to transform or x, y position. And be sure to update d3 elements’ position if map is dragged.
projectPosition(); //initialize elements position
map.on("viewreset", projectPosition); //listening to map event

function projectPosition() {
	mrtStations.attr("transform",
	function(d) {
		return "translate("+
			map.latLngToLayerPoint(d.LatLng).x +","+
			map.latLngToLayerPoint(d.LatLng).y +")";
		}
	)
}
Citation
The Taipei MRT data I used here is from longitude and latitude of Taipei MRT stations.
Source code
Embed d3 graphics in Jekyll
The goal is to embed d3 graphic in blog post. I follow the steps in this article.
- Create Github Gist and then paste the source code. Be sure to change the source path to “./”.
- Install bl.ocks.org extension for your browser. Then there will be a new button under “Download Gist”. Clicking it will bring us to the bl.ocks viewer of the gist.
- Create an iframe tag and set the src to the bl.ocks viewer url.
- For the source code, simply paste the url generated by Github Gist.
<iframe frameborder="0" height="600" marginheight="0" marginwidth="0" scrolling="no"
src="http://bl.ocks.org/licaschiou/raw/32aa65f0de3a40f05ae9/" width="800"></iframe>
Some Notes about building this blog.
-
Code hightlight syntax issue: I tried to use the familiar triple ` syntax, but Jekyll keeps generating funky results. I have to switch to
{% highlight javascript %}
someCode();
moreCode();
{% endhighlight %}to get the right result. Note that the double quotes in the syntax were put to prevent the text been converted.
- Having pages build failure issuse: When I first encountered the code highlighting issue, I tried rouge highlighter and it worked under localhost. But when I pushed the repository to Github, pages build failures happened. After some digging, I found the follow document. Quote: “ Although Jekyll lets you define your own highlighter, at this time GitHub Pages only supports pygments. … Using rouge or any other highlighter results in a build error.
- The highlighter issue hasn’t been fixed yet. I have to use rouge for local host and change to pygments for pushing.
- The Markdown syntax in Jekyll is somehow weird. For example, it takes two tabs to create sub-list under a list.
- ToDoList
1. Embed d3.js in post.
Some notes about ng-model in ng-repeat
Motivation
To use ng-repeat to dynamically generate directives according to dataset. Each directive controls the assign dataset element.
Sample Code
The ng-repeat block :
<div ng-repeat="data in objectDataset">
	<slider-ctrl data="data"></slider-ctrl>
</div>
The slider directive js:
app.directive('sliderCtrl', function(){
	return {
		link: link,
		restrict : 'E',
		scope: {
			data: '='
		},
		templateUrl : 'src/directives/sliderCtrl.html'
	};
});
The slider directive html:
<p>Current Value = </p>
<input type="range" ng-model="data.value">
Notes
- The wrong practice :
<p>Current Value = </p>
<input type="range" ng-model="data">
In this example, each iteration will create a childScope, and also assign the value to a new property data. When we change the value, ng-repeat will create new childScope for this new value, not overwriting the old one, and create performance issue.
To correct this issue, we have to pass the reference of the value to ng-model. Remember, “if you are not seeing a “ . “ in ng-model, you are doing something wrong.”